
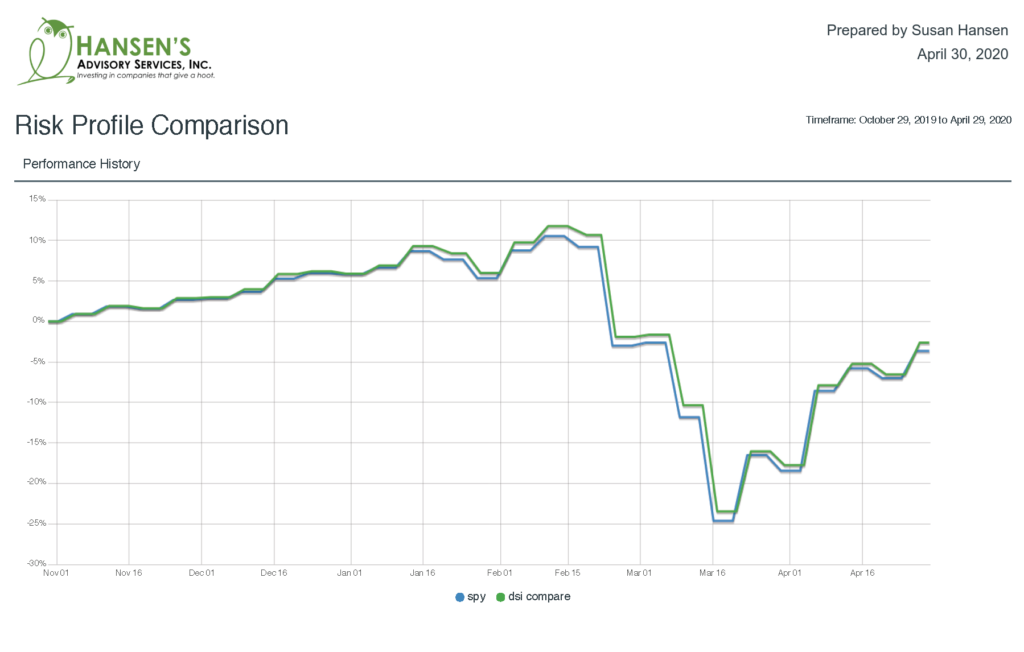
We often talk to our clients about how Socially Responsible Investments (SRI) have outperformed traditional investments during different periods of time. In 2019, before the coronavirus and the pandemic, companies that scored highly on ESG outperformed the broader market. How is it doing now? With the world turned upside down, how is SRI performing when compared to its traditional counterparts? Here is a graph created within HiddenLevers.com that shows the performance of the S&P 500 vs. MSCI KLD Index (Socially Responsible). See the attached PDF.
For a brief recap, SRI refers to the vetting of companies for their Environmental, Social, Governance (ESG) performance, in addition to their financial performance. We look at the companies as a whole, not just at how much money they make. By doing so, we’ve built portfolios of companies that are inherently sustainable, that are resilient, that have good governance, that treat their employees well and the environment…. Turns out, all of those traits suited them very well for the crisis we’re currently in.
Morningstar’s analysis shows that SRI/ESG funds are consistently outperforming during the coronavirus pandemic. And look at their reasoning why!
“Perhaps the biggest reason for their outperformance is that sustainable funds appear to have benefited from selecting stocks with better ESG credentials. A feature of sustainable funds is, of course, their emphasis on companies across sectors that have performed well on various ESG criteria. These tend to be companies that attend to their environmental challenges, treat their stakeholders well, and govern themselves in an ethical way. Many such companies are proving to be more resilient during the sudden crisis in which we now find ourselves. They are the quality companies of the 21st Century, and quality companies tend to hold up better than their lower-quality counterparts in difficult markets.”
Couldn’t have said it better myself.
Disclosure: Past performance is not indicative of future results.
IMPORTANT:
The projections generated by HiddenLevers regarding the likelihood of various investment outcomes are hypothetical in nature, do not reflect actual investment results, and are not guarantees of future results. Assumptions on rates of return and standard deviation used in this analysis are based on historical return data for each security and asset class. Past performance is no guarantee of future results. Results may vary with each use and over time.
You cannot invest directly in a benchmark or index. Index results do not reflect fees, expenses, or sales charges incurred when making investments.
Methodology Used to Generate this Report:
Definitions:
Beta – Beta measures the relationship between an investment and a major market index (the S&P 500 is used in this report). A beta of 1.0 means that a 1% rise in the S&P 500 could lead to a 1% rise in the investment, while a beta of -0.5 means that a 1% rise in the S&P 500 could lead to a 0.5% drop in the investment. The beta for an investment is determined by using regression analysis to measure the relationship between the returns of the investment and the returns of the S&P 500. HiddenLevers uses 10 years of data to measure the beta for an investment. For investments with less than 10 years of history, all available historical data is used.
Cross Correlations – HiddenLevers measures the correlation between every pair of investments in the portfolio. The correlation results can vary between 1 and -1, where a correlation of 1 means that two investments move together perfectly over time, and a correlation of -1 means that two investments move in opposite directions over time.
Expected Return – This is the 5-year total return of the portfolio based on the stress test scenarios selected for the report. The system takes the weighted average of the economic scenarios to calculate a one-year return, which is then compounded to determine the five-year return.
Lever – HiddenLevers tracks different levers (economic indicators) like CPI, US GDP Growth, and oil prices, and uses movements in these levers to define economic scenarios.
Lever Impact – The lever impacts section describes the impact of different economic levers on the portfolio as a whole. An S&P lever impact of 1.0, for example, means that a 1% rise in the S&P 500 is projected to lead to a 1% rise in the portfolio. HiddenLevers similarly measures the impact of a range of economic levers on the portfolio.
Maximum Drawdown (MDD) – this is measured as the largest percentage drop in a position during the timeframe of measurement. Click the + sign on the Risk Measures box to see the timeframe of measurement for Max Drawdown in the top right-hand corner of the box.
Scenario – A scenario is a representation of a major macro-economic or geopolitical event which has the potential to impact investment returns. HiddenLevers models scenarios as a set of up-or-down movements in any of the economic indicators (levers) in the system.
Scenario Impacts – Using HiddenLevers’ stress testing model, an upside and downside impact are projected for the portfolio in each scenario. Most scenarios are modeled with multiple potential outcomes, with both positive, neutral, and negative outcomes considered. The best and worst projections are derived from running the different scenario outcomes against the portfolio in
HiddenLevers model. The scenario-based stress testing model is discussed in detail in the Method section below.
Sharpe Ratio – The Sharpe Ratio is the a measure for calculating risk-adjusted return, and this ratio has become the industry standard for such calculations. It was developed by Nobel laureate William F. Sharpe. The Sharpe ratio is the average return earned in excess of the risk-free rate per unit of volatility or total risk. HiddenLevers calculates the Sharpe ratio by subtracting (12M) T-bill rates from the portfolio’s annualized total return, and then dividing by the portfolio’s volatility (annualized standard deviation).
Stress Test Risk/Reward – The Stress Test Risk/Reward compares the portfolio’s potential downside risk against the 5 year expected return of the portfolio.
Downside Risk: This is the maximum downside calculated across all of the scenarios included in the report.
5-Year Expected Return: HiddenLevers first calculates the expected return for the portfolio by calculating the one-year weighted average expected return across all included scenarios. The one-year expected return is then compounded to obtain a 5-year return estimate. Historically, major downside events occur roughly twice a decade, making 5 years an appropriate timeframe for comparison of long term returns and downside scenario risk.
Volatility – HiddenLevers measures volatility as the annualized standard deviation of an investment or portfolio, expressed in percentage terms. The standard deviation is calculated using weekly data points, and is then annualized by multiplying by the square-root of 52 (number of periods in one year).
Method: This report describes one or more potential scenarios, and shows the HiddenLevers-model based performance for the portfolio in each scenario. The steps below are performed to generate the projections:
Scenario -> Levers -> Assets (Stocks etc) -> Portfolio Return
A scenario pushes levers up or down, which in turn push assets up or down, which in turn impact a portfolio’s modeled return in the scenario. As defined above, a scenario is modeled as a set of movements in the levers.
Regression analysis is used to determine the historical (prior 10 year) relationship between each lever and each asset in the portfolio. The model is then run 2500 times for each scenario/portfolio combination. In each iteration, the model projects the returns for each asset using the historical regression coefficients for each lever, and using the scenario assumptions on how each lever will change. The model varies the regression coefficients for each iteration using a normal distribution around their mean (similar to a Monte Carlo model’s varying of expected returns across iterations), and aggregates the results of the 2500 iterations to find a mean portfolio return with a 95% confidence interval. The confidence interval is displayed on the report as “margin of error” for each scenario.
Limitations and Assumptions:
This report describes one or more potential scenarios that may or may not occur. Each scenario discussed in this report is defined by the economic assumptions listed in the Macro Impact section of each scenario page.
HiddenLevers does not guarantee that any particular scenario will occur as modeled in this report. HiddenLevers uses historical analysis in the creation of this report, and past performance is not a guarantee of future results. The information contained in this report is not to be construed as advice and should not be confused as any sort of advice. Investors should consider this report as only a single factor in making their investment decision.
Disclosures:
IMPORTANT: All results are hypothetical in nature, do not reflect actual investment results, and are not guarantees of future results. All results use simplifying assumptions that may not completely or accurately reflect the specific circumstances. As investment returns, inflation, taxes, and other economic conditions vary from the assumptions, your actual results will vary (perhaps significantly) from those presented here.
This Report does not provide legal, tax, or accounting advice. Before making decisions with legal, tax, or accounting ramifications, you should consult appropriate professionals for advice that is specific to your situation. This information is provided for your convenience, but should not be used as a substitute for account monthly statements and trade confirmations. It has been gathered from information provided by you and other sources believed to be reliable. Investors in Mutual Funds and ETFs should consider the investment objectives, risks, charges and expenses of the investment company carefully before investing. The prospectus and, if available, the summary prospectus contain this and other important information about the investment company. You can obtain a prospectus and summary prospectus from your financial representative. Read carefully before investing.
The opinions voiced in this material are for general information only and are not intended to provide specific advice or recommendations for any individual. To determine which investment(s) may be appropriate for you, consult your financial professional prior to investing. GxWorks LLC is not affiliated with any individual financial entity. Investment products are: not deposits, not FDIC/NCUA insured, not insured by any government agency, not bank guaranteed, subject to risk and may lose value.
GxWorks LLC, maker of software used to create this report, makes the following disclosures:
GxWorks LLC’s (GxWorks) mission is to educate and provide useful macro risk analytical tools to help provide data to assist with the investment decision process. GxWorks relies on financial data, including stock prices, provided by third parties. The data is believed to be accurate, but GxWorks does not guarantee or warranty this data. This report is intended only as an informational tool for you and your investment advisor, and should not in any way be construed as investment advice by GxWorks. If you make investment decisions based on information you receive in connection with this report, you do so at your own risk and neither GxWorks nor its employees will be liable for any losses that you may incur. GxWorks, its employees, officers or affiliates, in some instances, may have long or short positions or holdings in the securities or other related investments of companies mentioned herein. Users of this should conduct their own independent research and due diligence and consult with their investment advisor before making any investment decisions or recommendations.